Still have questions?
Jay Miller
Game Engineer

How to Take a Timings Report on your Minecraft Server
A timings report is a diagnostic tool on Spigot, Paper and SpongeForge servers that provides a detailed breakdown of server performance. It is often used to diagnose where server lag is coming from and is an extremely useful tool for managing your server.
For many, it can be challenging to read timings reports. This is perfectly normal – at a first glance, it can appear to just be a sea of numbers and colours. Don’t worry; we’re always on hand to provide assistance so please get in touch if you’re stuck.
OP Permissions
You must have Operator (OP) permissions to create a timings report, click here to learn how to become an OP.
#How to Take a Timings Report in Spigot/Paper
You can take a timings report by using the command when connected to your Spigot or Paper server.
-
Connect to your Server
-
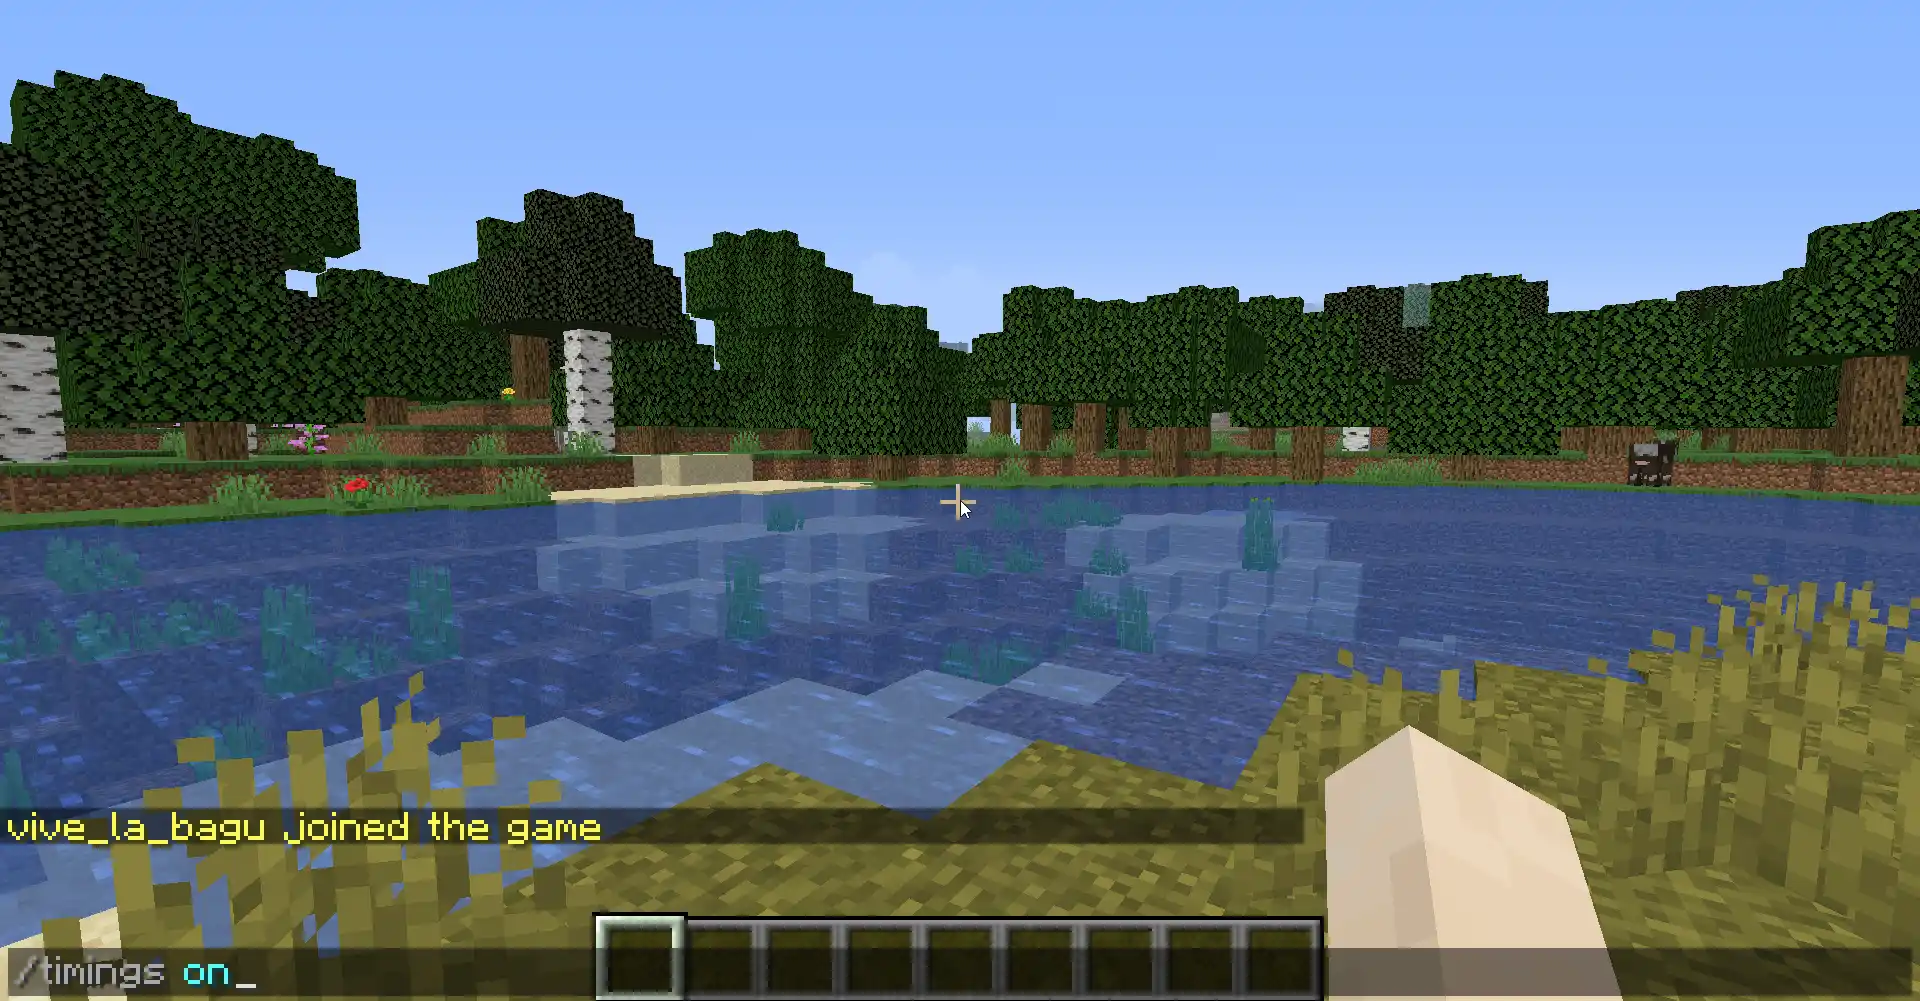
When experiencing the performance issues on your server, enter the command
/timings on.
-
You will see a message appear in the chat – after this message appears, wait for at least ten minutes. The timings report is being taken in the background!
-
After around 10-15 minutes, issue the command
/timings paste.
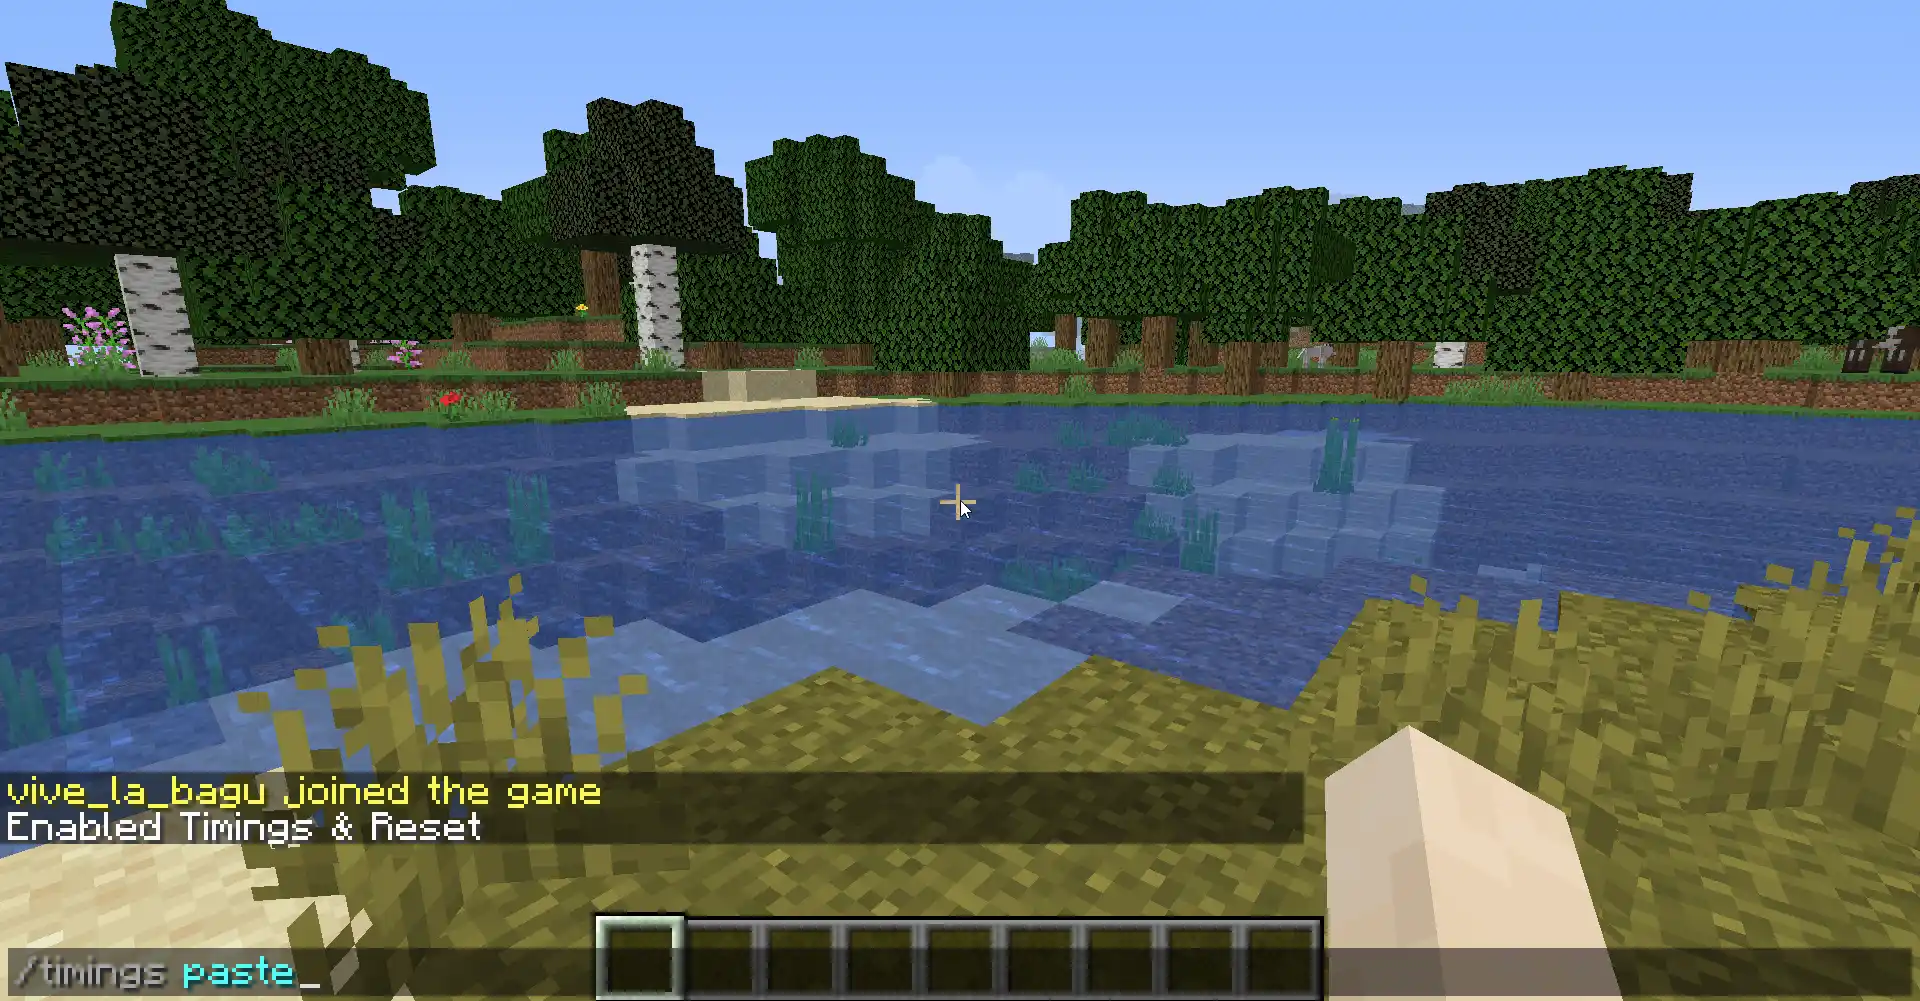
- A link will appear in the chat – this is your timings report!
#How to Take a Timings Report in SpongeForge
You can take a timings report by using the command when connected to your SpongeForge server.
-
Connect to your server.
-
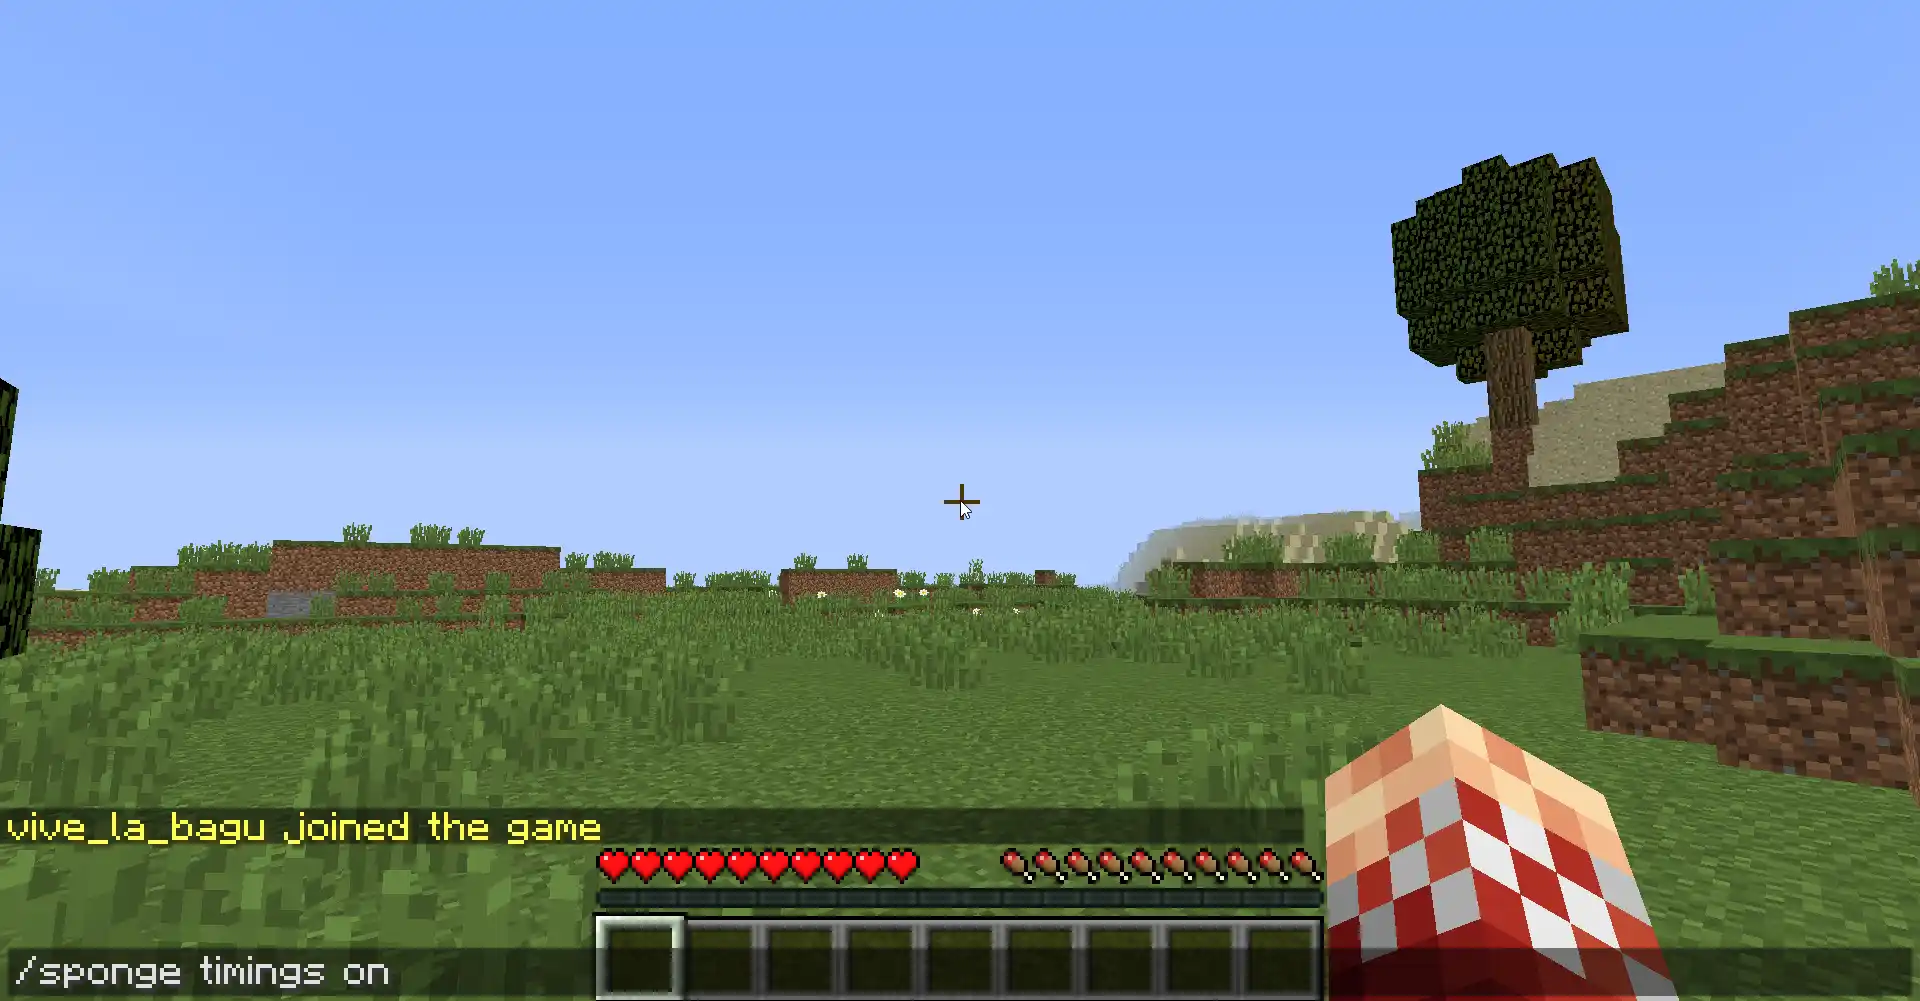
As soon as you are experiencing performance issues on your server, issue the command
/sponge timings on.
- Wait at least 10 minutes before issuing the command
/sponge timings report. Waiting for 10 minutes gives us the most accurate representation of where your server isn't performing so well.
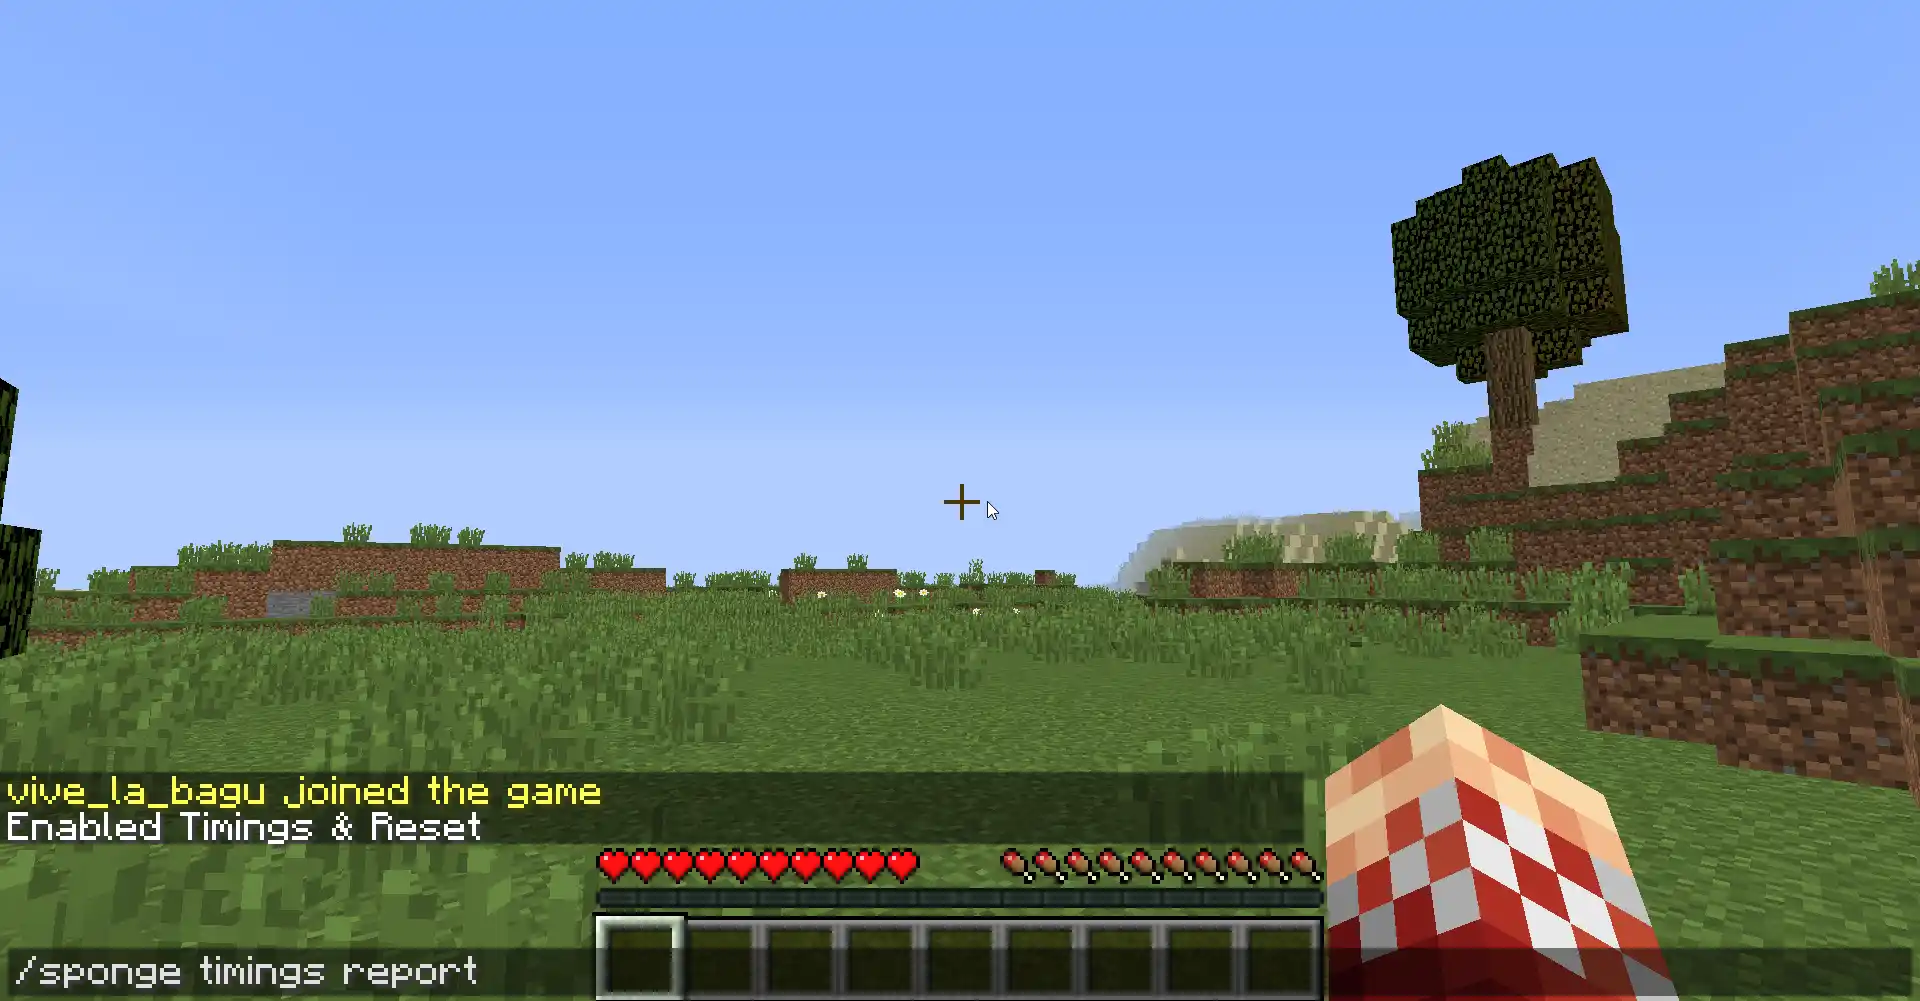
- You will then see a link appear - this is your timings report!
#Analyze your Timings report
To learn how to analyze a timings report, please follow this tutorial: How to Analyze any Timings Report